Review


Structured Review

Merck & Co human plasma fibronectin purified protein
A: Fluorescence micrographs of cells stained with Phalloidin (F-actin), Vinculin and pMLC specific antibodies showing the impact of ARHGEF17 KD on cell morphology during spreading. Cells were detached, allowed to spread for 1 hour on <t>fibronectin-coated</t> coverslips. Images acquired using a 100x planApo oil immersion objective. B: Quantification of phalloidin, pMLC and vinculin fluorescence intensities in control and ARHGEF17 KD cells (Images acquired using a 100x objective). Distance intensity plots are shown for intensity of staining from cell border towards cell center. Shaded area indicates standard deviation. n= 477 cells (242 Control, 235 KD). C: Time-lapse series showing cell spreading and polarisation in control versus ARHGEF17 KD cells. Increased spreading and robust contractile F-actin structures are noted in KD cells within the first five hours as compared to control cells. At 12 hours, thicker contractile fibers are observed in ARHGEF17 KD cells. D: Quantitative analysis of area and solidity of control and KD cells after 5 hours of spreading, measured at time point 5 hours. Boxplot with interquartile ranges and superimposed violin plots are shown to provide an intuition about the measurement distributions. White bar indicates population average. n=2033 (945 Control, 1088 KD). Statistical test: Mann-Whitney U test. E: SIM images of spreading cells expressing MLC-mCherry in control and ARHGEF17 KD cells. High magnification panels showing (1) MLC in edge proximal lamella (2) MLC in edge distal lamella. The panels have been oriented to be parallel to the edge, with the retrograde actin flow being oriented from top to bottom (denoted by the red arrow). Scale bars: (A) 10 µm, (C) 5 µm, (E) 10 µm, (E) Insets: 2 µm
Human Plasma Fibronectin Purified Protein, supplied by Merck & Co, used in various techniques. Bioz Stars score: 90/100, based on 1 PubMed citations. ZERO BIAS - scores, article reviews, protocol conditions and more
https://www.bioz.com/result/human plasma fibronectin purified protein/product/Merck & Co
Average 90 stars, based on 1 article reviews
human plasma fibronectin purified protein - by Bioz Stars, 2026-03
90/100 stars

Images

1) Product Images from "Feedback regulation by the RhoA-specific GEF ARHGEF17 regulates actomyosin network disassembly"

Article Title: Feedback regulation by the RhoA-specific GEF ARHGEF17 regulates actomyosin network disassembly

Journal: bioRxiv

doi: 10.1101/2024.08.28.610052

A: Fluorescence micrographs of cells stained with Phalloidin (F-actin), Vinculin and pMLC specific antibodies showing the impact of ARHGEF17 KD on cell morphology during spreading. Cells were detached, allowed to spread for 1 hour on fibronectin-coated coverslips. Images acquired using a 100x planApo oil immersion objective. B: Quantification of phalloidin, pMLC and vinculin fluorescence intensities in control and ARHGEF17 KD cells (Images acquired using a 100x objective). Distance intensity plots are shown for intensity of staining from cell border towards cell center. Shaded area indicates standard deviation. n= 477 cells (242 Control, 235 KD). C: Time-lapse series showing cell spreading and polarisation in control versus ARHGEF17 KD cells. Increased spreading and robust contractile F-actin structures are noted in KD cells within the first five hours as compared to control cells. At 12 hours, thicker contractile fibers are observed in ARHGEF17 KD cells. D: Quantitative analysis of area and solidity of control and KD cells after 5 hours of spreading, measured at time point 5 hours. Boxplot with interquartile ranges and superimposed violin plots are shown to provide an intuition about the measurement distributions. White bar indicates population average. n=2033 (945 Control, 1088 KD). Statistical test: Mann-Whitney U test. E: SIM images of spreading cells expressing MLC-mCherry in control and ARHGEF17 KD cells. High magnification panels showing (1) MLC in edge proximal lamella (2) MLC in edge distal lamella. The panels have been oriented to be parallel to the edge, with the retrograde actin flow being oriented from top to bottom (denoted by the red arrow). Scale bars: (A) 10 µm, (C) 5 µm, (E) 10 µm, (E) Insets: 2 µm
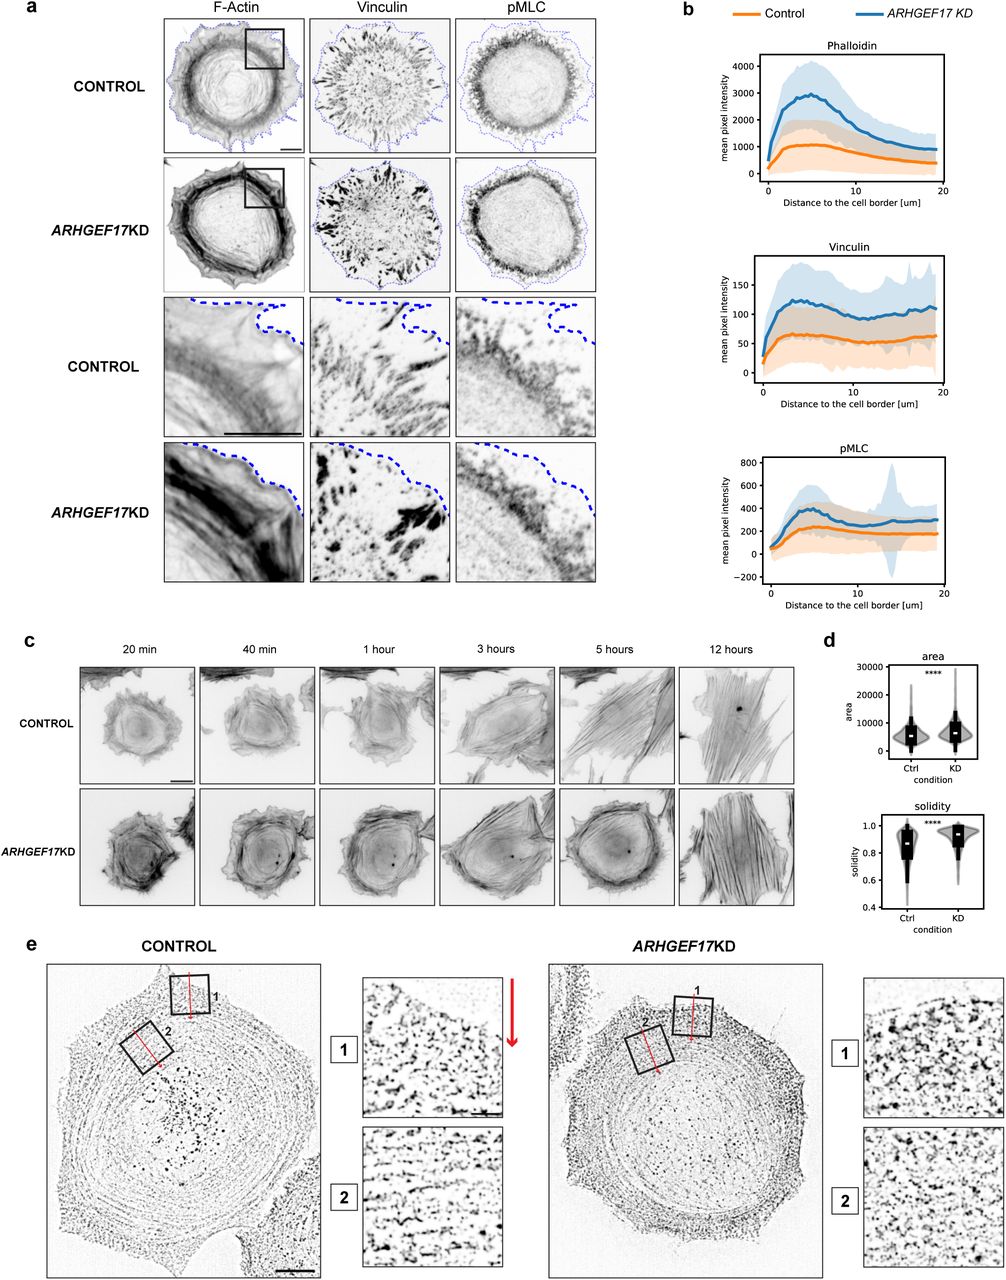
Figure Legend Snippet: A: Fluorescence micrographs of cells stained with Phalloidin (F-actin), Vinculin and pMLC specific antibodies showing the impact of ARHGEF17 KD on cell morphology during spreading. Cells were detached, allowed to spread for 1 hour on fibronectin-coated coverslips. Images acquired using a 100x planApo oil immersion objective. B: Quantification of phalloidin, pMLC and vinculin fluorescence intensities in control and ARHGEF17 KD cells (Images acquired using a 100x objective). Distance intensity plots are shown for intensity of staining from cell border towards cell center. Shaded area indicates standard deviation. n= 477 cells (242 Control, 235 KD). C: Time-lapse series showing cell spreading and polarisation in control versus ARHGEF17 KD cells. Increased spreading and robust contractile F-actin structures are noted in KD cells within the first five hours as compared to control cells. At 12 hours, thicker contractile fibers are observed in ARHGEF17 KD cells. D: Quantitative analysis of area and solidity of control and KD cells after 5 hours of spreading, measured at time point 5 hours. Boxplot with interquartile ranges and superimposed violin plots are shown to provide an intuition about the measurement distributions. White bar indicates population average. n=2033 (945 Control, 1088 KD). Statistical test: Mann-Whitney U test. E: SIM images of spreading cells expressing MLC-mCherry in control and ARHGEF17 KD cells. High magnification panels showing (1) MLC in edge proximal lamella (2) MLC in edge distal lamella. The panels have been oriented to be parallel to the edge, with the retrograde actin flow being oriented from top to bottom (denoted by the red arrow). Scale bars: (A) 10 µm, (C) 5 µm, (E) 10 µm, (E) Insets: 2 µm

Techniques Used: Fluorescence, Staining, Control, Standard Deviation, MANN-WHITNEY, Expressing


Similar Products

90
Millipore human plasma fibronectin purified protein
Human Plasma Fibronectin Purified Protein, supplied by Millipore, used in various techniques. Bioz Stars score: 90/100, based on 1 PubMed citations. ZERO BIAS - scores, article reviews, protocol conditions and more
https://www.bioz.com/result/human plasma fibronectin purified protein/product/Millipore
Average 90 stars, based on 1 article reviews
human plasma fibronectin purified protein - by Bioz Stars, 2026-03
90/100 stars
  Buy from Supplier

90
Merck & Co human plasma fibronectin purified protein
A: Fluorescence micrographs of cells stained with Phalloidin (F-actin), Vinculin and pMLC specific antibodies showing the impact of ARHGEF17 KD on cell morphology during spreading. Cells were detached, allowed to spread for 1 hour on <t>fibronectin-coated</t> coverslips. Images acquired using a 100x planApo oil immersion objective. B: Quantification of phalloidin, pMLC and vinculin fluorescence intensities in control and ARHGEF17 KD cells (Images acquired using a 100x objective). Distance intensity plots are shown for intensity of staining from cell border towards cell center. Shaded area indicates standard deviation. n= 477 cells (242 Control, 235 KD). C: Time-lapse series showing cell spreading and polarisation in control versus ARHGEF17 KD cells. Increased spreading and robust contractile F-actin structures are noted in KD cells within the first five hours as compared to control cells. At 12 hours, thicker contractile fibers are observed in ARHGEF17 KD cells. D: Quantitative analysis of area and solidity of control and KD cells after 5 hours of spreading, measured at time point 5 hours. Boxplot with interquartile ranges and superimposed violin plots are shown to provide an intuition about the measurement distributions. White bar indicates population average. n=2033 (945 Control, 1088 KD). Statistical test: Mann-Whitney U test. E: SIM images of spreading cells expressing MLC-mCherry in control and ARHGEF17 KD cells. High magnification panels showing (1) MLC in edge proximal lamella (2) MLC in edge distal lamella. The panels have been oriented to be parallel to the edge, with the retrograde actin flow being oriented from top to bottom (denoted by the red arrow). Scale bars: (A) 10 µm, (C) 5 µm, (E) 10 µm, (E) Insets: 2 µm
Human Plasma Fibronectin Purified Protein, supplied by Merck & Co, used in various techniques. Bioz Stars score: 90/100, based on 1 PubMed citations. ZERO BIAS - scores, article reviews, protocol conditions and more
https://www.bioz.com/result/human plasma fibronectin purified protein/product/Merck & Co
Average 90 stars, based on 1 article reviews
human plasma fibronectin purified protein - by Bioz Stars, 2026-03
90/100 stars
  Buy from Supplier

90
Millipore fibronectin human plasma fibronectin purified protein fc010-5mg
A: Fluorescence micrographs of cells stained with Phalloidin (F-actin), Vinculin and pMLC specific antibodies showing the impact of ARHGEF17 KD on cell morphology during spreading. Cells were detached, allowed to spread for 1 hour on <t>fibronectin-coated</t> coverslips. Images acquired using a 100x planApo oil immersion objective. B: Quantification of phalloidin, pMLC and vinculin fluorescence intensities in control and ARHGEF17 KD cells (Images acquired using a 100x objective). Distance intensity plots are shown for intensity of staining from cell border towards cell center. Shaded area indicates standard deviation. n= 477 cells (242 Control, 235 KD). C: Time-lapse series showing cell spreading and polarisation in control versus ARHGEF17 KD cells. Increased spreading and robust contractile F-actin structures are noted in KD cells within the first five hours as compared to control cells. At 12 hours, thicker contractile fibers are observed in ARHGEF17 KD cells. D: Quantitative analysis of area and solidity of control and KD cells after 5 hours of spreading, measured at time point 5 hours. Boxplot with interquartile ranges and superimposed violin plots are shown to provide an intuition about the measurement distributions. White bar indicates population average. n=2033 (945 Control, 1088 KD). Statistical test: Mann-Whitney U test. E: SIM images of spreading cells expressing MLC-mCherry in control and ARHGEF17 KD cells. High magnification panels showing (1) MLC in edge proximal lamella (2) MLC in edge distal lamella. The panels have been oriented to be parallel to the edge, with the retrograde actin flow being oriented from top to bottom (denoted by the red arrow). Scale bars: (A) 10 µm, (C) 5 µm, (E) 10 µm, (E) Insets: 2 µm
Fibronectin Human Plasma Fibronectin Purified Protein Fc010 5mg, supplied by Millipore, used in various techniques. Bioz Stars score: 90/100, based on 1 PubMed citations. ZERO BIAS - scores, article reviews, protocol conditions and more
https://www.bioz.com/result/fibronectin human plasma fibronectin purified protein fc010-5mg/product/Millipore
Average 90 stars, based on 1 article reviews
fibronectin human plasma fibronectin purified protein fc010-5mg - by Bioz Stars, 2026-03
90/100 stars
  Buy from Supplier

90
Millipore human plasma fibronectin purified protein fc010
KEY RESOURCES TABLE
Human Plasma Fibronectin Purified Protein Fc010, supplied by Millipore, used in various techniques. Bioz Stars score: 90/100, based on 1 PubMed citations. ZERO BIAS - scores, article reviews, protocol conditions and more
https://www.bioz.com/result/human plasma fibronectin purified protein fc010/product/Millipore
Average 90 stars, based on 1 article reviews
human plasma fibronectin purified protein fc010 - by Bioz Stars, 2026-03
90/100 stars
  Buy from Supplier

90
Millipore 5 µg/ml human plasma fibronectin purified protein
KEY RESOURCES TABLE
5 µg/Ml Human Plasma Fibronectin Purified Protein, supplied by Millipore, used in various techniques. Bioz Stars score: 90/100, based on 1 PubMed citations. ZERO BIAS - scores, article reviews, protocol conditions and more
https://www.bioz.com/result/5 µg/ml human plasma fibronectin purified protein/product/Millipore
Average 90 stars, based on 1 article reviews
5 µg/ml human plasma fibronectin purified protein - by Bioz Stars, 2026-03
90/100 stars
  Buy from Supplier

Image Search Results


A: Fluorescence micrographs of cells stained with Phalloidin (F-actin), Vinculin and pMLC specific antibodies showing the impact of ARHGEF17 KD on cell morphology during spreading. Cells were detached, allowed to spread for 1 hour on fibronectin-coated coverslips. Images acquired using a 100x planApo oil immersion objective. B: Quantification of phalloidin, pMLC and vinculin fluorescence intensities in control and ARHGEF17 KD cells (Images acquired using a 100x objective). Distance intensity plots are shown for intensity of staining from cell border towards cell center. Shaded area indicates standard deviation. n= 477 cells (242 Control, 235 KD). C: Time-lapse series showing cell spreading and polarisation in control versus ARHGEF17 KD cells. Increased spreading and robust contractile F-actin structures are noted in KD cells within the first five hours as compared to control cells. At 12 hours, thicker contractile fibers are observed in ARHGEF17 KD cells. D: Quantitative analysis of area and solidity of control and KD cells after 5 hours of spreading, measured at time point 5 hours. Boxplot with interquartile ranges and superimposed violin plots are shown to provide an intuition about the measurement distributions. White bar indicates population average. n=2033 (945 Control, 1088 KD). Statistical test: Mann-Whitney U test. E: SIM images of spreading cells expressing MLC-mCherry in control and ARHGEF17 KD cells. High magnification panels showing (1) MLC in edge proximal lamella (2) MLC in edge distal lamella. The panels have been oriented to be parallel to the edge, with the retrograde actin flow being oriented from top to bottom (denoted by the red arrow). Scale bars: (A) 10 µm, (C) 5 µm, (E) 10 µm, (E) Insets: 2 µm

Journal: bioRxiv

Article Title: Feedback regulation by the RhoA-specific GEF ARHGEF17 regulates actomyosin network disassembly

doi: 10.1101/2024.08.28.610052

Figure Lengend Snippet: A: Fluorescence micrographs of cells stained with Phalloidin (F-actin), Vinculin and pMLC specific antibodies showing the impact of ARHGEF17 KD on cell morphology during spreading. Cells were detached, allowed to spread for 1 hour on fibronectin-coated coverslips. Images acquired using a 100x planApo oil immersion objective. B: Quantification of phalloidin, pMLC and vinculin fluorescence intensities in control and ARHGEF17 KD cells (Images acquired using a 100x objective). Distance intensity plots are shown for intensity of staining from cell border towards cell center. Shaded area indicates standard deviation. n= 477 cells (242 Control, 235 KD). C: Time-lapse series showing cell spreading and polarisation in control versus ARHGEF17 KD cells. Increased spreading and robust contractile F-actin structures are noted in KD cells within the first five hours as compared to control cells. At 12 hours, thicker contractile fibers are observed in ARHGEF17 KD cells. D: Quantitative analysis of area and solidity of control and KD cells after 5 hours of spreading, measured at time point 5 hours. Boxplot with interquartile ranges and superimposed violin plots are shown to provide an intuition about the measurement distributions. White bar indicates population average. n=2033 (945 Control, 1088 KD). Statistical test: Mann-Whitney U test. E: SIM images of spreading cells expressing MLC-mCherry in control and ARHGEF17 KD cells. High magnification panels showing (1) MLC in edge proximal lamella (2) MLC in edge distal lamella. The panels have been oriented to be parallel to the edge, with the retrograde actin flow being oriented from top to bottom (denoted by the red arrow). Scale bars: (A) 10 µm, (C) 5 µm, (E) 10 µm, (E) Insets: 2 µm

Article Snippet: REF-52 cells with optoLARG construct and LifeAct-miRFP were transfected with ARHGEF17-mCherry (kindly provided by Olivier Rocks) and plated on glass bottom well plates (Celvis) which were coated with 5 μg/mL of human plasma fibronectin purified protein (Merck) for one hour at room temperature.

Techniques: Fluorescence, Staining, Control, Standard Deviation, MANN-WHITNEY, Expressing

KEY RESOURCES TABLE

Journal: Cell reports

Article Title: NF-κB memory coordinates transcriptional responses to dynamic inflammatory stimuli

doi: 10.1016/j.celrep.2022.111159

Figure Lengend Snippet: KEY RESOURCES TABLE

Article Snippet: Human Plasma Fibronectin Purified Protein , Millipore Sigma , FC010.

Techniques: Control, Recombinant, Reverse Transcription, Clinical Proteomics, Purification, cDNA Synthesis, TaqMan Probe Assay, DNA Library Preparation, Plasmid Preparation, Software